Grafana is the go-to platform for visualization. But what if you could interact with your Grafana dashboards, alerts, and configurations directly from your IDE?
That’s where Model Context Protocol (MCP) comes in. MCP makes it possible to connect external tools (like Grafana) to AI-assisted workflows inside VS Code. With an MCP server, you can query dashboards, manage alerts, or even generate panels—without leaving your coding environment.
In this post, I’ll show you how to:
- Run a Grafana MCP server
- Connect it with VS Code
- Run couple of prompts on Agent
Prerequisites
- VS Code with Copilot
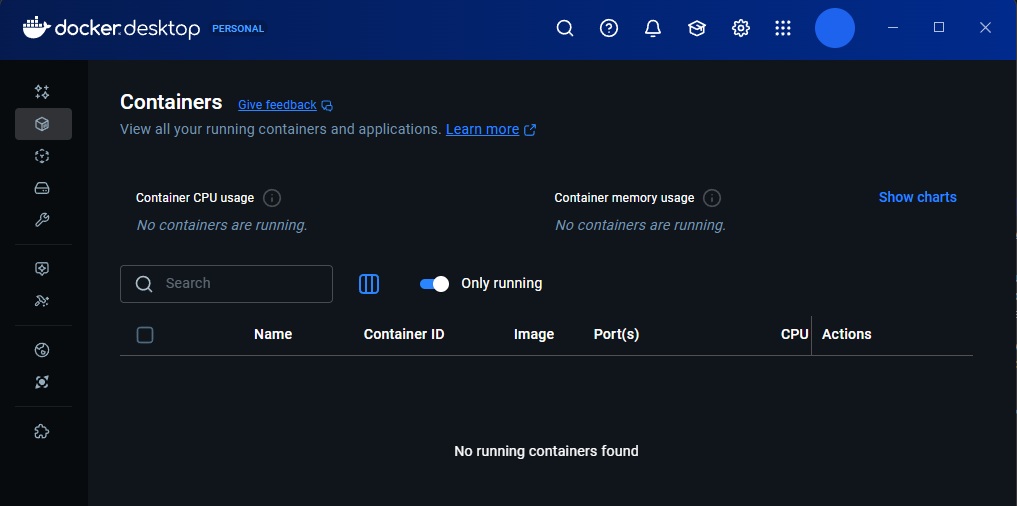
- Docker Desktop
- A Grafana instance (local or remote) with a Service Account Token (Users and access -> Service accounts -> Add service account)
Note:
- Grafana version 9.0 or later is required for full functionality.
- We won’t be discussing about installing the above prerequisites in this post.
VS Code with Copilot: Make sure you select Agent and highlighted in the below snap

Docker Desktop:

Grafana along with SA Account:

You can set mcp servers in VS Code globally or specific to the project, in this blog post I will set global
Add mcp.json under “C:\Users\machani\AppData\Roaming\Code\User”. Save the below content in mcp.json
{
	"servers": {
		"grafana": {
			"command": "docker",
			"args": [
				"run",
				"--rm",
				"-i",
				"-e",
				"GRAFANA_URL",
				"-e",
				"GRAFANA_API_KEY",
				"mcp/grafana",
				"-t",
				"stdio",
				"-debug"
			],
			"env": {
				"GRAFANA_URL": "https://mygrafana-test.net/grafana",
				"GRAFANA_API_KEY": "glsa_OzFVE6lG7hsssUxqccGZnTLabcd"
			},
			"type": "stdio"
		}
	},
	"inputs": []
}
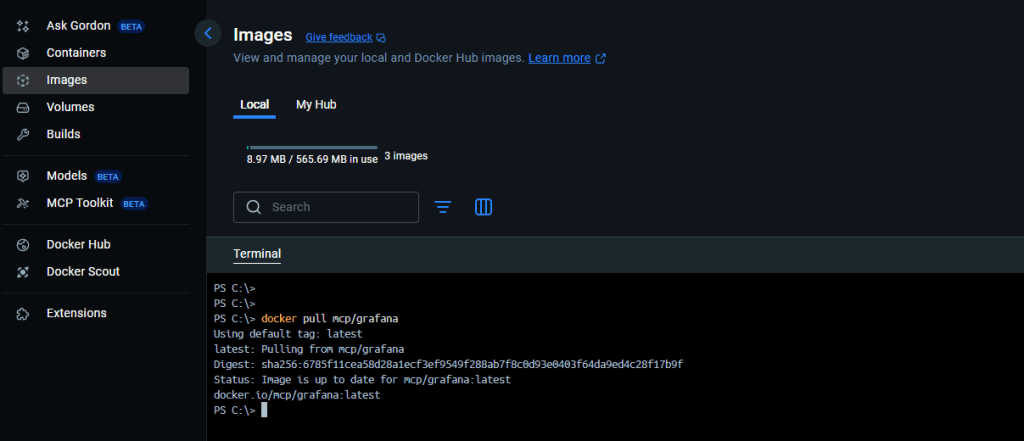
Now VS Code knows how to start your Grafana MCP server automatically. Before you start prompting the Agent, pull the docker image: Grafana MCP by running below command on the terminal.
docker pull mcp/grafana
Now, your docker desktop shows this image:

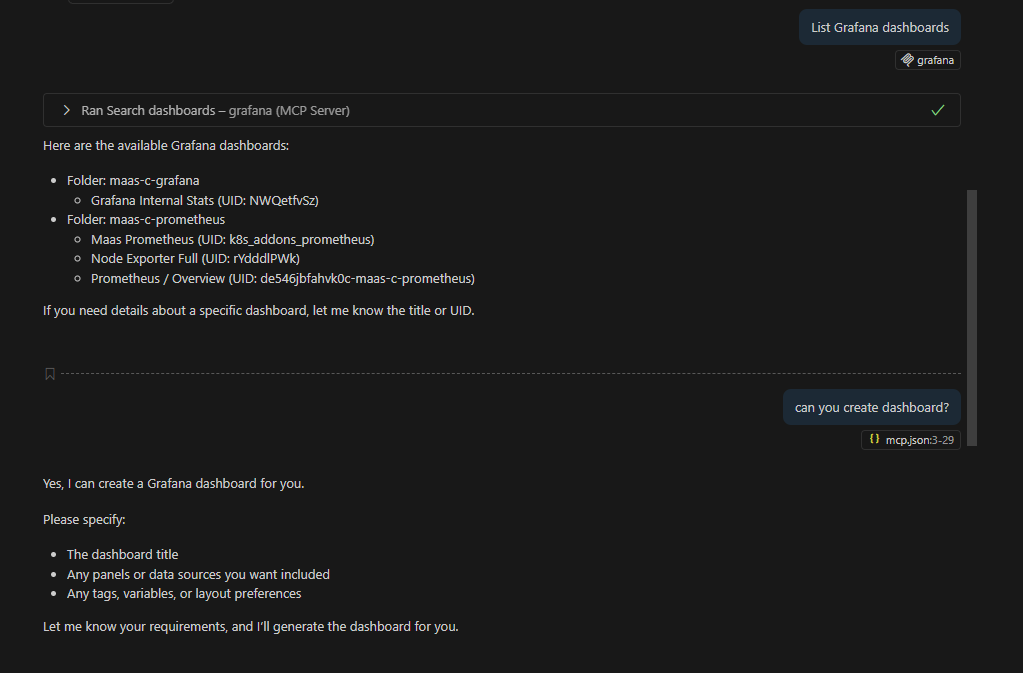
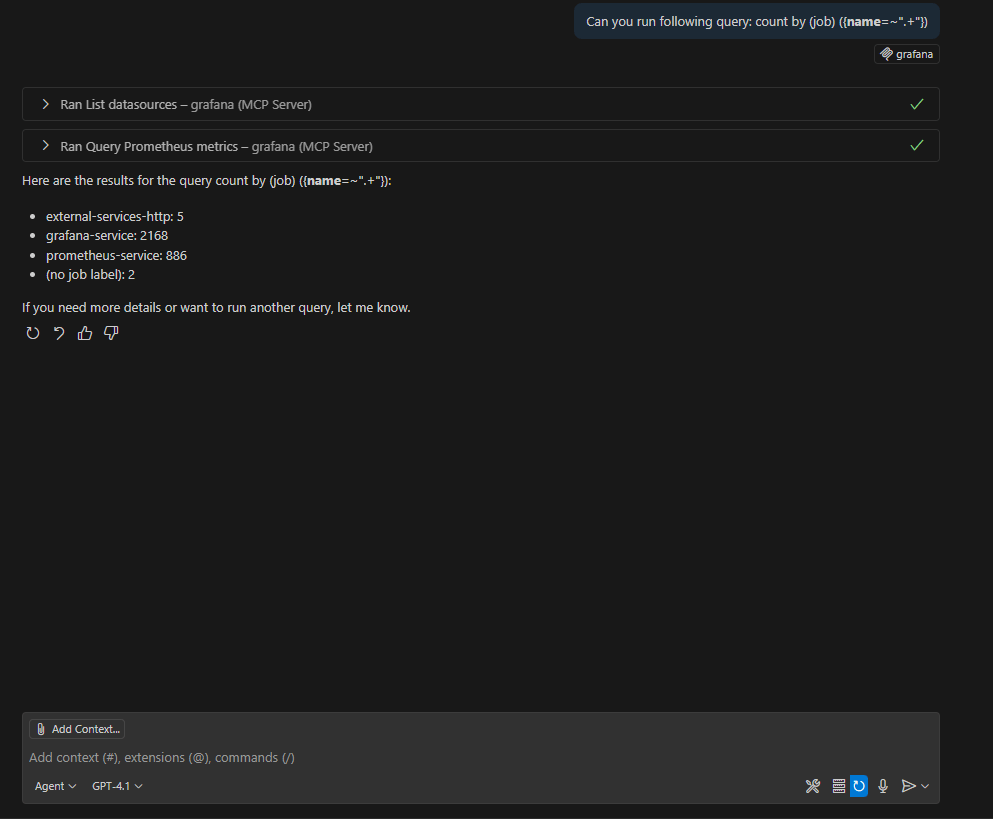
Use Grafana MCP in VS Code
Below are few prompts I tried:


Conclusion
With MCP, Grafana becomes natively accessible inside VS Code. You no longer need to alt-tab between browser and IDE—your observability data is right where you code.
This setup is especially useful for:
- DevOps teams managing multiple dashboards
- Developers embedding Grafana queries into projects
- SREs troubleshooting incidents with context from monitoring tools
👉 Next, you can extend this by connecting other MCP servers (like Prometheus or ServiceNow) and build a fully AI-assisted observability workflow.
Fore more information, refer: https://github.com/grafana/mcp-grafana
Cheers!
Leave a comment