A few weeks ago, I dived into Grafana Beyla, and I was blown away by its simplicity and power. The promise of “zero-instrumentation” monitoring is a game-changer for developers and SREs who want deep insights without cluttering their codebases with instrumentation libraries.
In this post, I’ll share my experience and walk you through how to configure Grafana Beyla directly within Grafana Alloy to automatically capture RED metrics (Rate, Errors, Duration) from a sample application and visualize them in Grafana.
Step 1: Understanding the Key Players
Grafana Beyla: An eBPF-based application auto-instrumentation tool. It works by attaching to your running application at the kernel level to capture network traffic and other system calls. From this, it intelligently infers application-level data like HTTP requests, database queries, and more, converting them into standard OpenTelemetry formats (metrics and traces).
Grafana Alloy: A powerful, vendor-neutral telemetry collector based on the OpenTelemetry Collector. It can scrape, receive, process, and export logs, metrics, traces, and profiles. What makes it perfect for this use case is that Beyla is integrated as a component (beyla.ebpf), allowing you to build a complete observability pipeline in a single configuration file.
RED Metrics: A standard for monitoring services, popularized by Tom Wilkie and championed by the SRE community. They give you a high-level overview of your service’s health:
- Rate: The number of requests your service is handling per second.
- Errors: The number of requests that are failing.
- Duration: The time it takes for your requests to complete (latency), often measured in percentiles like p90, p95, and p99.
Step 2: Configuring Grafana Alloy with Beyla
I used Alloy CRD for this, copy below content into a file and running in it.
apiVersion: collectors.grafana.com/v1alpha1
kind: Alloy
metadata:
  name: alloy-beyla
  namespace: beyla
spec:
  controller:
    hostPID: true
  alloy:
    securityContext:
      privileged: true
    configMap:
      content: |-
        beyla.ebpf "default" {
          attributes {
            kubernetes {
              cluster_name = "pre-prod-cce"
              enable = "true"
            }
          }
          discovery {
            services {
              open_ports = "80"
            }
          }
          metrics {
            features = [
              "application",
              "application_process",
              "application_service_graph",
              "application_span",
              "network",
            ]
          }
        }

        prometheus.scrape "beyla" {
          targets      = beyla.ebpf.default.targets
          honor_labels = true
          forward_to   = [prometheus.remote_write.rw.receiver]
        }

        prometheus.remote_write "rw" {
          endpoint {
            url = "https://<prometheus-endpoint>/prometheus/api/v1/write"
            basic_auth {
              username = "write-user"
              password = "azbcdqD?"
            }
          }
        }

        logging {
          level  = "debug"
          format = "logfmt"
        }
You should see the pod running:

Important alloy service settings:
- pid: “host”: This allows the Alloy container to see processes running on the host machine (and in other containers), which is necessary for Beyla to find and attach to our app service.
- privileged: true: eBPF requires elevated permissions to load programs into the kernel. For production, you should use more granular Linux capabilities (CAP_SYS_ADMIN, CAP_BPF, CAP_PERFMON), but privileged is simplest for a demo.
- open_ports: The port of the running service for Beyla automatically instrumented with eBPF.
You can try different export modes available @ https://grafana.com/docs/beyla/latest/configure/export-modes/
More details about this configuration, can be found @ https://grafana.com/docs/alloy/latest/reference/components/beyla/beyla.ebpf/
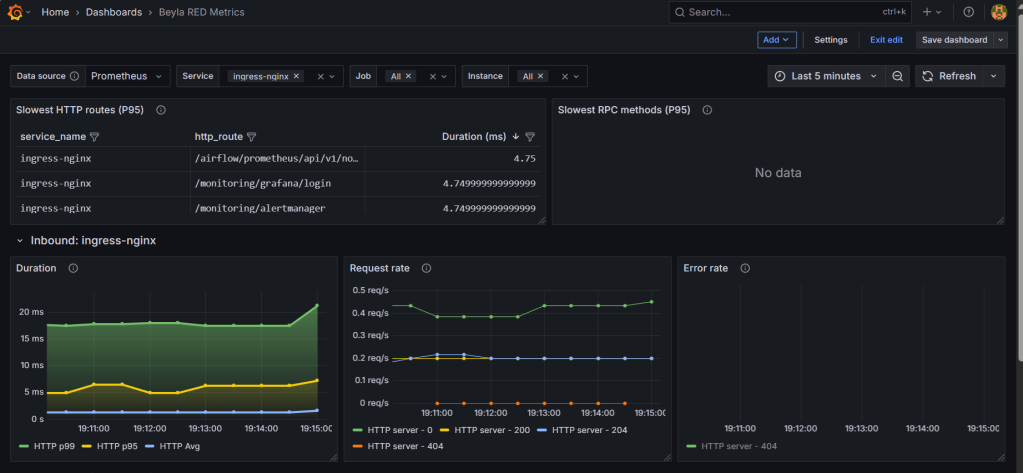
Step 3: Visualize the RED Metrics in Grafana
After a minute or two, metrics should start flowing into your Grafana instance.
- Go to your Grafana instance
- Import RED dashboard. Dashboard ID: 19923
- Open to view the RED metrics!
Conclusion
That’s it! In just a few steps, we successfully:
- Configured Grafana Alloy to use its integrated Beyla component.
- Automatically instrumented the application using eBPF without any code changes.
- Collected and visualized the essential RED metrics in Grafana.
This workflow is incredibly powerful. It decouples observability from the application development lifecycle, allowing teams to gain deep insights into any compatible binary, whether it’s their own service, a third-party tool, or a legacy system they can’t easily modify.
Happy monitoring!

Leave a comment