The “Why”: When to Use HTTP SD over Native Kubernetes SD
Prometheus is the undisputed king of monitoring in the Kubernetes ecosystem. Its built-in service discovery mechanisms (kubernetes_sd_configs) are brilliant, effortlessly discovering Pods, Services, and Endpoints. For 90% of use cases, this is all you’ll ever need.
But what about the other 10%? What happens when your monitoring targets live outside the cluster? How do you scrape legacy VMs, on-premise databases, or IoT devices? What if the decision to scrape a target requires complex logic that can’t be expressed in relabel_configs?
This is where you graduate to the next level of Prometheus mastery: HTTP Service Discovery (HTTP SD).
HTTP SD is a powerful mechanism that turns the discovery process on its head. Instead of Prometheus pulling metadata from a known API (like the Kubernetes API), it polls a simple HTTP endpoint that you create. This endpoint’s job is to return a list of targets in a specific JSON format.
This simple concept unlocks incredible flexibility. Your source of truth for monitoring targets can now be anything: a CMDB, a custom service registry, a cloud provider API, or even a simple text file.
The Practical Guide: Monitoring External Services from Kubernetes
Let’s build a complete, end-to-end example.
Our Goal: We want our in-cluster Prometheus to monitor a list of external services. This list is maintained in a simple YAML file (simulating an external servers) and contains rich metadata like the environment, application.
Step 1: The Source of Truth (A ConfigMap)
First, we’ll define our external targets in a Kubernetes ConfigMap. In the real world, your HTTP service would query a database or API, but this lets us create a self-contained example.
configmap.yaml
apiVersion: v1
kind: ConfigMap
metadata:
  name: external-targets-cm
  namespace: monitoring
data:
  targets.yaml: |
    - name: legacy-database
      address: "192.168.1.50:9100" # Example IP of a node_exporter
      environment: "development"
      application: "linux-node-exporter
Step 2: The Heart of the System – The HTTP SD Service
This is the custom component we’ll build. It’s a simple web server written in Python using Flask that performs one crucial task: it reads our YAML file, transforms it into the JSON format Prometheus expects, and serves it on an endpoint.
Here is our server code. It’s robust enough to handle missing fields with sensible defaults.
http_sd_server.py
import os
import yaml
from flask import Flask, jsonify, Response

app = Flask(__name__)

CONFIG_FILE_PATH = os.environ.get("CONFIG_FILE_PATH", "/config/targets.yaml")

def format_targets_for_prometheus(target_list):
    prometheus_targets = []
    if not target_list:
        return []

    for target in target_list:
        if "address" not in target or "name" not in target:
            continue

        prometheus_targets.append({
            "targets": [target["address"]],
            "labels": {
                "service_name": target["name"],
                "environment": target.get("environment", "unknown"),
                "application": target.get("application", "unknown")
            }
        })
    return prometheus_targets

@app.route('/targets')
def get_targets():
    try:
        with open(CONFIG_FILE_PATH, 'r') as f:
            external_targets = yaml.safe_load(f)

        formatted_targets = format_targets_for_prometheus(external_targets)
        return jsonify(formatted_targets)

    except FileNotFoundError:
        print(f"Error: Config file not found at {CONFIG_FILE_PATH}")
        return jsonify({"error": "Configuration file not found"}), 500
    except Exception as e:
        print(f"An error occurred: {e}")
        return jsonify({"error": "An internal error occurred"}), 500

@app.route('/healthz')
def healthz():
    return Response("OK", status=200)

if __name__ == '__main__':
    app.run(host='0.0.0.0', port=8080)
requirements.txt
Flask
PyYAML
Step 3: Containerize and Deploy
We’ll package this service into a Docker image and deploy it to our Kubernetes cluster.
Dockerfile
FROM python:3.9-slim

WORKDIR /app

COPY requirements.txt .
RUN pip install --no-cache-dir -r requirements.txt

COPY http_sd_server.py .

EXPOSE 8080

ENV CONFIG_FILE_PATH=/config/targets.yaml
CMD ["python", "http_sd_server.py"]
Build and push it to your registry:
docker build -t xxx.devops.xxx.com/machani_vidyasagar/http-sd-server:v1
docker push xxx.devops.xxx.com/machani_vidyasagar/http-sd-server:v1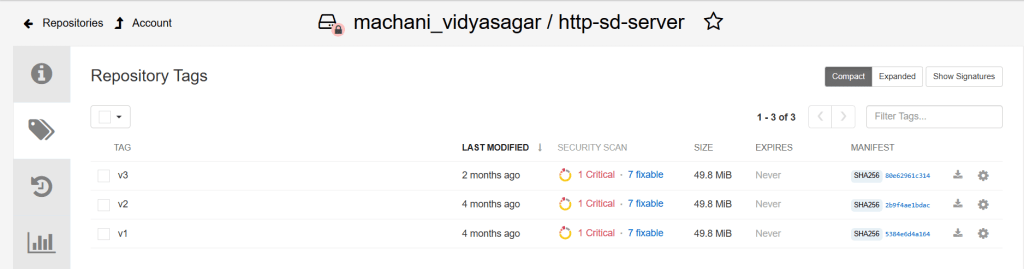
Now, deploy it to Kubernetes along with a Service
deployment.yaml
apiVersion: apps/v1
kind: Deployment
metadata:
  name: http-sd-server-deployment
  namespace: monitoring
  labels:
    app: http-sd-server
spec:
  replicas: 1
  selector:
    matchLabels:
      app: http-sd-server
  template:
    metadata:
      labels:
        app: http-sd-server
    spec:
      containers:
        - name: server
          image: xxx.devops.xxx.com/machani_vidyasagar/http-sd-server:v3
          imagePullPolicy: IfNotPresent
          ports:
          - containerPort: 8080
          livenessProbe:
            httpGet:
              path: /healthz
              port: 8080
            initialDelaySeconds: 5
            periodSeconds: 15
          volumeMounts:
          - name: config-volume
            mountPath: /config
            readOnly: true
      imagePullSecrets:
        - name: registry-pull-secret
      volumes:
      - name: config-volume
        configMap:
          name: external-targets-cm
---
apiVersion: v1
kind: Service
metadata:
  name: http-sd-endpoint-svc
  namespace: monitoring
spec:
  selector:
    app: http-sd-server
  ports:
  - protocol: TCP
    port: 80
    targetPort: 8080
Apply all the manifests: kubectl apply -f configmap.yaml and kubectl apply -f deployment.yaml
Step 4: Tell Prometheus Where to Look
# In your Prometheus CRD spec:
additionalScrapeConfigs:
  - job_name: 'external-services-http'
    http_sd_configs:
      - url: http://http-sd-endpoint-svc.monitoring.svc.cluster.local/targets
    relabel_configs:
      - source_labels: [__meta_http_sd_label_service_name]
        target_label: instance
      - action: labelmap
        regex: __meta_http_sd_label_(.+)
The labelmap action is a game-changer. It saves you from writing a separate relabel_config for environment, application, making your configuration clean and scalable.
Verification: See the Results
Once Prometheus reloads its configuration, you can verify everything in the Prometheus UI:
- Service Discovery: Navigate to Status -> Service Discovery. You will see your new external-services-http job with active targets. Click on it to inspect the “Discovered Labels” (__meta_…) coming directly from your Python service.
- Targets: Navigate to Status -> Targets. You will see your three external services listed. Crucially, you’ll also see the beautiful, clean labels (instance, environment, datacenter, owner) that you created, all ready for querying.

Note:
The line app.run(…) starts a single-threaded development server. It is explicitly not for production use. It can only handle one request at a time.
In Production you should consider implementing following:
- Production-Grade WSGI Server
- Caching (Crucial for Performance)
- Horizontal Scaling and High Availability
By implementing these standard web service best practices, your HTTP SD endpoint can easily handle polling from dozens of Prometheus instances and generate target lists containing tens of thousands of endpoints without breaking a sweat.
Conclusion:
While Prometheus’s native Kubernetes service discovery is fantastic, HTTP SD is the escape hatch you need for ultimate power and flexibility. It allows you to integrate Prometheus with any system, enrich your metrics with deep contextual labels, and truly make Prometheus the central hub for monitoring your entire infrastructure—both inside and outside of Kubernetes.
Happy scraping..!

Leave a comment