In this post, I’ll demonstrate how to use Grafana Alloy — the powerful telemetry agent— to forward local syslog data to Loki, Grafana’s log aggregation system. We’ll also walk through how Alloy collects system metrics and forwards them to Prometheus using remote_write. This setup is especially useful for hybrid environments or distributed systems where logs and metrics must be centralized for observability.
This use case leverages Alloy’s modular design to:
- Scrape local system (node-exporter) metrics and ship them to a Prometheus backend.
- Listen for local syslog messages and parse them before sending to Loki.
- Apply relabeling to filter out unwanted metrics dynamically.
Let’s dive into the configuration and see how it all comes together.
Why Grafana Alloy?
- Unified Agent: Consolidate your monitoring agents, reducing overhead and complexity.
- Flexible Pipelines: Its “Flow” syntax allows for powerful data processing and routing.
- Lightweight: Designed to be efficient and consume minimal resources.
- Open Source: Community-driven and extensible.
Prerequisites
Before we dive in, make sure you have:
- A Linux server: Where Grafana Alloy will be installed.
- Grafana Alloy installed: Follow the official Grafana Alloy documentation for installation instructions on your specific Linux distribution.
- Access to Loki and Prometheus endpoints
- Local Syslog Daemon configured: Your Linux server’s syslog daemon (e.g., rsyslog, syslog-ng) needs to be configured to send messages to Grafana Alloy.
[Refer, this post for configuring rsyslog]
The Grafana Alloy Configuration
Let’s break down the alloy.river configuration provided. This single file encapsulates both our metrics and logs pipelines.
Create a file named config.alloy (or similar) on your remote Linux server and paste the following content:
logging {
  level = "debug" // Set to "info" for production; "debug" is good for initial setup.
}

// --- Prometheus Metrics Pipeline ---

// 1. Expose local system metrics (CPU, memory, disk, network, etc.)
prometheus.exporter.unix "local_system" { }

// 2. Scrape the local system metrics exporter
prometheus.scrape "scrape_metrics" {
  targets         = prometheus.exporter.unix.local_system.targets // Target the local exporter
  forward_to      = [prometheus.relabel.filter_metrics.receiver]  // Send to relabeling stage
  scrape_interval = "10s"     // Scrape every 10 seconds
}

// 3. Relabeling: Filter out specific metrics based on labels
prometheus.relabel "filter_metrics" {
  rule {
    action        = "drop"  // Drop metrics if they match the rule
    source_labels = ["env"] // Look at the 'env' label
    regex         = "dev"   // Drop if 'env' label's value is "dev"
  }

  forward_to = [prometheus.remote_write.metrics_service.receiver] // Forward to remote write
}

// 4. Remote Write: Send processed metrics to Prometheus
prometheus.remote_write "metrics_service" {
  endpoint {
    url = "https://prometheus.example.system.net/prometheus/api/v1/write"

    basic_auth {
      username = "monitoring"
      password = "<password>" // In a real setup, use secrets management for passwords!
    }
  }
}

// --- Loki Logs Pipeline ---

// 1. Syslog Source: Listen for local syslog messages
loki.source.syslog "local" {
  listener {
    address       = "127.0.0.1:1601" // Alloy listens on this local address/port
    syslog_format = "rfc3164"    // Specify the syslog format
    labels        = {            // Add static labels to all incoming logs
      component = "loki.source.syslog",
      protocol  = "tcp",
    }
  }

  forward_to = [loki.process.rsyslog_parser.receiver] // Forward to the processing stage
}

// 2. Log Processing: Parse syslog messages using regex and extract labels
loki.process "rsyslog_parser" {
  forward_to = [loki.write.local.receiver] // Forward processed logs to Loki write stage

  stage.regex {
    // This regex extracts 'application' and 'remoteServerAddress' from messages like:
    // "mydaemon: remote server at 192.168.1.10 connected"
    expression = "^(?P<application>[^:]+):.*remote server at (?P<remoteServerAddress>\\S+).*"
  }

  stage.labels {
    // Promote the extracted fields from the regex stage into Loki labels
    values = {
      application         = "",
      remoteServerAddress = "",
    }
  }
}

// 3. Loki Write: Send processed logs to Loki
loki.write "local" {
  endpoint {
    url = "https://prometheus.example.system.net/loki/api/v1/push"
  }
}
Key Components Explained
📈 Prometheus Metrics
prometheus.exporter.unix: Scrapes system metrics such as CPU and memory from the local host.prometheus.relabel: Filters out metrics labeled withenv=devto avoid sending unnecessary data.prometheus.remote_write: Pushes filtered metrics securely to the central Prometheus instance via basic auth.
🪵 Syslog Ingestion via Loki
loki.source.syslog: Binds to127.0.0.1:1601and listens for syslog messages in RFC 3164 format over TCP.loki.process: Applies a regular expression to extract structured labels from syslog content, such as the application name and remote server address.loki.write: Forwards the parsed logs to Loki using its HTTP Push API.
Deployment Steps
- Save the Configuration: Save the alloy.river content into a file, for example, /etc/alloy/config.alloy.
2. Restart alloy and check the status
systemctl restart alloy
systemctl status alloy
journalctl -u alloy.service --no-pager -n 50
Verification
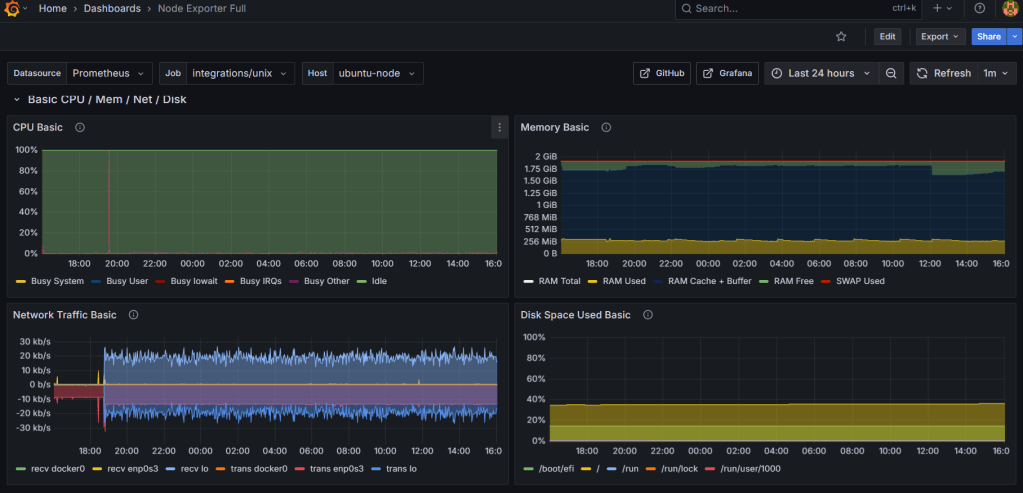
Node Exporter Metrics in Grafana:
Logs in Loki:
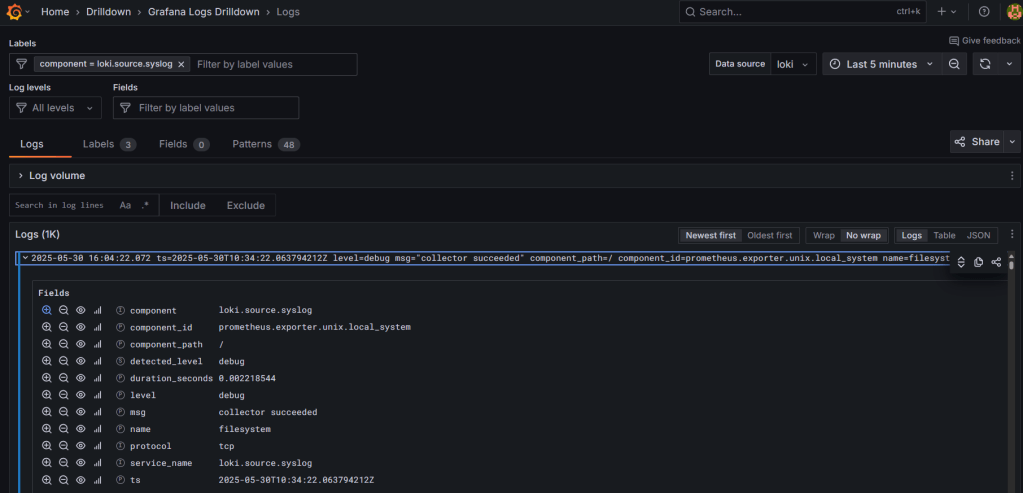
Label Verification to make sure RegEx is working:


Leave a comment